September 4, 2026
·
20 min read
Chat Message Metrics in 2026: Reliability, Time, and Outcomes
A case study that settles what “chat message metrics” should mean in 2026 — message vs conversation units, hop-by-hop instrumentation with IDs and clocks, reliability baselines, core time metrics (first contact, pacing, abandonment, resolution), and outcome metrics (CSAT coverage, goal conversion, trend-window limits) so you can decide what to fix first.

You put a chat bubble on your site because you want visitors to get answers quickly and turn into customers. But when you try to measure “how chat is doing,” the obvious numbers can mislead you—especially when some messages arrive late, never get seen, or get counted in ways you didn’t intend.
This case study walks you through 11 chat message metrics worth tracking in 2026: how to define the unit you’re counting, how to map the open→send→find flow, where to add timestamps and IDs across the message path, which reliability metrics to verify before speed, and how to connect responsiveness to outcomes like CSAT coverage and goal conversion.
Define chat message
SERP mismatch fix
If you searched “chat message,” you probably saw results about consumer messaging: Google Chat, Google Messages, or APIs for sending messages inside those products. For example, the Google Chat API even documents a maximum message size of 32,000 bytes—useful, but it’s not what this article is measuring.
Here, “chat message” means a message exchanged in website live chat: a visitor types into a chat bubble on your site, and someone on your team replies.
Units that matter
Before you look at any metric, decide what your tool is counting. Three units show up over and over, and they change the denominator for every “rate” you calculate.
-
Message (the atomic unit)
-
One inbound or outbound text entry in the chat thread.
-
Use this when you care about delivery, duplicates, or “did the visitor see the reply?” at the message level.
-
Conversation (a thread of messages)
-
A grouped interaction that starts when the user “joins” the chat and ends when it’s closed.
-
Some systems define the start very specifically: Zendesk’s First reply time starts when the end user joins the chat—when they send the first message or reply to a proactive message—and ends at the agent’s first response.
-
Some reporting won’t even count a conversation until at least one customer message is sent (so outbound conversations that never get a reply can disappear from metrics).
-
Chat request (a demand for service)
-
A visitor entering the queue asking to be served by an agent.
-
This is the unit behind “missed chat”: Zendesk defines missed chats as chat requests not served by any agent before the visitor leaves.
-
It’s also the unit behind “wait” metrics: Zendesk’s Chat wait time is the time the end user waited for the first agent reply; if nobody replies, it becomes the total time waited before leaving.
If you don’t label the unit first, you’ll think you’re comparing performance—when you’re really comparing definitions.
Open, send, find
In this article, a chat message is one inbound or outbound entry in the live-chat thread on your website. The practical UX question is simple: what exact user action creates a message, and what action merely opens a chat UI.
-
Open the chat (visitor)
Click the on-site chat bubble to expand the widget. Treat this as “opened” (UI state), not “started” (analytics unit), because an open can happen with zero messages. -
Start the thread (visitor sends the first message)
Type into the widget and hit Send/Enter. That’s the first inbound message event, and it’s usually the cleanest “conversation start” moment for reporting. -
Keep the unit straight as the thread continues
Every time the visitor hits Send again, that’s another inbound message inside the same conversation. Your later metrics need to say which object they count: messages (atomic events) or conversations (the grouped thread). -
Find incoming messages (operator)
Incoming messages land in an operator inbox (an agent-facing queue/view). In Telegram-routed setups, incoming events can be delivered via the Telegram Bot API as HTTPS POST “updates” to your webhook URL; if your endpoint responds with a non-2XX status code, Telegram will retry the request a reasonable number of times. -
Send a chat message back (operator)
Reply from your inbox/app; each reply is one outbound message. If Telegram is in the path, note the rich-text limit of 32,768 UTF-8 characters, and Telegram’s guidance to avoid sending more than one message per second in a single chat.
If you can’t point to the exact UI action that creates a message event, your “per chat message” metrics won’t be stable enough to compare week to week.
Instrument the message path
If you only measure what the chat UI shows, you’ll get a single “reply time” number—and no way to tell whether the delay was your site, your server, Telegram, or the agent.
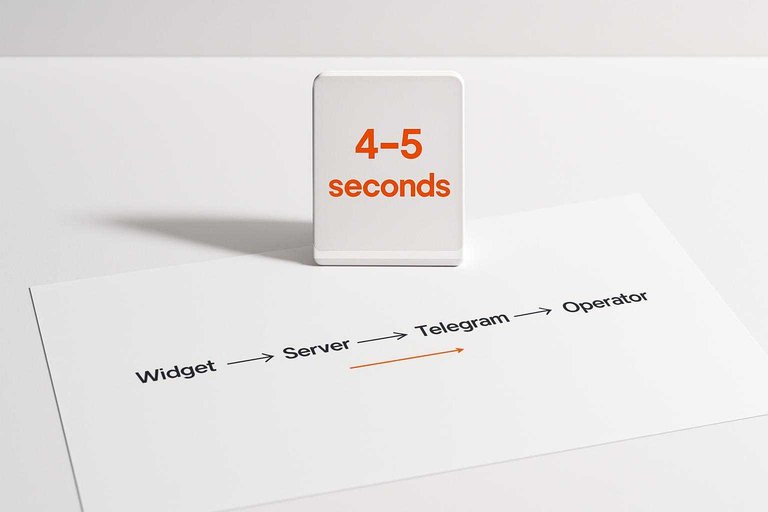
Treat a chat message as an end-to-end event that crosses specific boundaries (widget accepts Send → server ingest → server forward to Telegram → operator receives → operator replies → server receives reply → widget renders). Add a small set of IDs and timestamps at those boundaries so you can localize slowness and loss instead of arguing about one blended “reply time.”
Hop-by-hop map
Here’s the end-to-end path you’re actually operating, with the main “lost or delayed” points called out:
-
Visitor → widget (browser)
-
Event to log: visitor clicks Send and the widget accepts the message.
-
Can fail/delay: the widget never sends (JS error), or queues locally and doesn’t flush.
-
Widget → your server (ingest)
-
Event to log: your server receives the inbound message.
-
Can fail/delay: network retries/timeouts; request arrives twice.
-
Your server → Telegram (forward)
-
Event to log: your server submits the message to Telegram and gets an acknowledgment.
-
Can fail/delay: forwarding fails; you retry and create duplicates if you don’t dedupe.
-
Telegram → operator (delivery + attention)
-
Event to log: Telegram delivers an update/event to your integration endpoint (or to the client app).
-
Can fail/delay: delivery retries; the operator simply doesn’t see it yet.
-
Operator → Telegram (reply send)
-
Event to log: operator hits Send; Telegram accepts the outbound message.
-
Can fail/delay: operator’s client is offline; send fails and is retried.
-
Telegram → your server (reply arrives)
-
Event to log: your server receives the operator reply event/update.
-
Can fail/delay: out-of-order arrival; duplicate delivery.
-
Your server → widget (deliver reply)
-
Event to log: your server makes the reply available to the widget.
-
Can fail/delay: delivery mechanism adds delay (webhook vs polling); client misses updates.
-
Widget → visitor (render/seen)
-
Event to log: the widget renders the reply in the UI.
-
Can fail/delay: the user’s tab is suspended; rendering is delayed.
One concrete example: Eloqra routes each visitor message into Telegram and then back to the on-site widget, which makes it a clean case study for why you need hop-level timestamps, not just an inbox “sent/received” view.
IDs and clocks
You don’t need a dozen fields. You need the right ones, consistently, on both inbound and outbound paths.
-
Required IDs (for joins, dedupe, and “same message across hops”)
-
conversation_id: stable thread identifier (created at first inbound message). -
message_id: unique per message (inbound and outbound). -
direction:inbound(visitor → operator) vsoutbound(operator → visitor). -
provider_msg_id(optional but valuable): the Telegram-side identifier if you have it, so you can match retries/duplicates at the provider boundary. -
Minimal timestamps (put them at hop boundaries)
-
t_client_send: when the widget accepts the message (browser time). -
t_server_ingest: when your server receives it (server time). -
t_server_forwarded: when your server hands it to Telegram (server time). -
t_server_reply_ingest: when your server receives the operator reply (server time). -
t_client_render: when the widget renders the reply (browser time). -
Clock pitfalls that quietly break time metrics
-
Don’t subtract a browser timestamp from a server timestamp and call it “latency.” They’re different clocks.
-
Use server-to-server deltas for hop latency wherever you can (server time is at least one clock).
-
Keep client timestamps anyway, but treat them as “perceived” timing (what the visitor experienced), not as a precise measurement of backend work.
If you can’t join events by message_id end-to-end, you’ll end up measuring “a message like this” instead of this message, and reliability metrics become guesswork.
Delivery mechanics
Two plumbing choices add their own latency and failure modes, and they’re easy to miss if you only look at a chat dashboard.
A webhook (push delivery) is when one system sends event updates by HTTP POST to your URL; failures and retries matter because they affect delivery reliability and can create duplicates. In Telegram’s Bot API, you configure this with setWebhook, and Telegram will repeat the request when your endpoint returns a non‑2XX HTTP status code, giving up after a reasonable number of attempts. That means you must log your webhook receipt time and make your handler idempotent (safe to process twice).
Short polling (client pull delivery) is a near-real-time technique where the client checks the server at a fixed interval for new data; the interval itself adds latency and shapes what “instant” feels like. If your widget polls every roughly 4–5 seconds, then even a perfectly fast backend can’t make replies appear faster than the next poll tick unless you add a push channel.
Report distributions
Once you have hop timestamps, don’t collapse them into a single average. You want the shape of the experience.
An SLO (service level objective) framed with percentile latency is a target like “X% of events finish within Y.” Percentiles (p50/p95/p99) let you separate the typical experience from the tail: the 50th percentile (median) shows what’s normal, while high percentiles like p99 show a plausible worst-case that users actually hit. Google’s SRE guidance is explicit on this: percentiles help you reason about the distribution, not just a single number.
So for each hop (and for end-to-end “visitor send → visitor sees reply”), report at least p50 and p95/p99, then pick an SLO that matches the experience you’re trying to protect. When p50 is fine but p99 is awful, you’re looking at a pipeline problem, not an agent problem.
Reliability metrics first (the leak check before you chase speed)
If you optimize “reply time” on a leaky pipeline, you’ll ship improvements that only exist in reports. Start with reliability: did the chat request get served, did the message get delivered, and did the visitor actually see it?
-
Missed chat rate
Missed chat means a chat request that was not served by any agent before the visitor left. Treat it as your top-level “we weren’t there” counter. -
Measure:
missed_chats / total_chat_requests. -
Slice it by why it was missed using your existing hop logs: request created, routed, accepted/served, and visitor left.
-
Watch for definition drift: a “conversation” report can quietly exclude requests that never became a conversation.
-
Acceptance rate (served after routing)
Acceptance rate is the share of chats routed to an agent that they actually served. In Zendesk’s Chat Analytics CSV glossary, “Acceptance” is defined as the percentage of assigned chats that were served out of all chats routed to the agent—and Zendesk also notes that if auto-accept is turned on, the acceptance report is not displayed. -
Measure (even if your UI hides it):
served_after_assignment / routed_to_agent. -
Use it as a routing/coverage integrity check: if chats are getting routed but not served, your time-to-first-reply metric is now a partial truth.
-
Unanswered inbound message rate (the “nobody replied” leak)
This is the message-level cousin of missed chat: inbound messages that never get a corresponding outbound agent message. -
Measure:
inbound_messages_without_any_outbound_reply / total_inbound_messages. -
Join on
conversation_idand/ormessage_idso you don’t “count a thread” when you meant “count this message.” -
This is where you separate “we responded quickly” from “we responded, but only to some of what users sent.”
-
Delivery failure + retry metrics (especially webhook-fed paths)
When events are delivered to you via webhooks (HTTP POSTs to your endpoint), delivery reliability is shaped by retries, concurrency, and basic networking constraints. -
Track at the provider boundary:
webhook_deliveries_received,non_2xx_responses,duplicate_deliveries(same provider message ID), and “age when processed” (how long it sat before your handler completed). -
Throughput knob you can actually point at: Telegram’s Bot API
setWebhooksupportsmax_connectionsin the range 1–100, with a default of 40 simultaneous HTTPS connections. -
“It never arrives” bugs can be embarrassingly physical: Telegram webhooks are supported on ports 443, 80, 88, 8443.
-
Throughput constraints (rate limits become reliability limits)
A system that can’t keep up doesn’t just get slower; it starts failing sends, retrying, and creating duplicates. -
For Telegram bots, the FAQ documents a free bulk notification broadcast limit of 30 messages per second; exceeding it can trigger 429 errors.
-
Telegram also documents paid broadcasts, which raise the limit to 1000 messages per second after enabling them.
-
Metric to keep honest:
send_attempts,send_successes,429_count, and “queued outbound messages” during spikes.
Land these first. Then, when you move on to time metrics, you’ll be measuring the speed of a pipeline that actually delivers.
Core time metrics
Time metrics look objective because they’re “just timestamps.” In live chat, they’re only comparable when you pin down (1) what event starts the clock, (2) what stops it, and (3) what conversations/messages get excluded. Otherwise you’ll “improve” a number by changing routing mode, closing behavior, or grouping—not by getting faster.
One non-negotiable: for every time metric below, report a distribution, not a single average. Use at least median (p50) plus a tail metric like p95 or p99, because time data is lopsided: a few ugly delays can be the whole customer story even when the average looks fine.
First-contact timing
First reply time / First response time is the time from a customer joining a chat to the first human agent reply; many tools define “join” as “the end user sends the first message or responds to a proactive message,” which is a different start point than “chat widget opened.” That start condition is the gotcha: if you start the clock at “assigned to agent” in one tool and at “customer joined” in another, you’re no longer comparing the same thing.
Chat wait time is the customer-perceived waiting time for that first agent reply; if nobody replies, it becomes “waited until leaving.” That makes it the more honest metric for abandonment-prone entry queues, because it still has a value when the outcome is silence.
Zendesk’s own guidance frames live chat expectations tightly—“good” can be 1 minute or less, and “best” can be instantly—but those targets only mean anything if your clock starts at the same “customer joined” moment week to week, and you keep the “no agent reply” cases in view instead of letting them vanish into exclusions.
In-chat pacing
Response time (subsequent) is the time from the customer’s previous message to the agent’s next reply during an ongoing conversation. It answers a different question than first reply time: not “how fast did we pick it up?” but “how fast did we keep up once we were talking?”
The measurement trap is treating every message as a clean back-and-forth turn. Real chats come in bursts: customers send two or three messages in a row, agents type and send two short replies, and some tools batch or auto-collapse those into one “agent response.” If you compute response time per message without grouping, you can create nonsense like “the agent responded before the customer asked” (because you paired the wrong boundary messages).
Make the rule explicit: either (a) measure turn-based timing (customer burst → agent burst) or (b) measure per-message timing but define how you handle consecutive messages. Then stick to it across tools, exports, and weeks.
If you’re pulling raw events, do it from a source that lets you see the underlying message timestamps (for example, via a chat API) rather than trusting whatever an inbox UI decided counted as a single reply.
Abandonment signal
Chat no reply time is the time from the customer’s last unanswered message until they leave the chat session. Read it literally: it’s “how long they waited before giving up,” measured from the final inbound message that never got a human response.
This is distinct from “missed chat.” “Missed chat” is a chat request that was never served; no reply time can happen inside a conversation that did start but then stalled (for example, the agent answered once, then stopped replying).
Treat it as an abandonment signal you can trend with a distribution: median no reply time tells you the typical “silent stall,” and p95/p99 tells you how long your worst cases are left hanging before they exit.
Resolution timing
Time to close / Time to resolution is elapsed time from conversation start until it is closed. It’s the metric most likely to drift, because “closed” is a workflow decision, not a physics event.
Two gotchas to pin down in writing before you compare anything:
- Eligibility/exclusions: some systems only count conversations that a teammate actually closes (so “never closed” threads can disappear from resolution reporting).
- What time is included: platforms may publish multiple variants that include or exclude automation/bot inbox time and include or exclude office-hours time. Mixing those variants can fully explain a “faster resolution” chart without any change in agent behavior.
If you want time to close to be defensible, decide which variant you’ll treat as canonical, and always publish it with median + p95/p99. The tail is where stuck conversations hide.
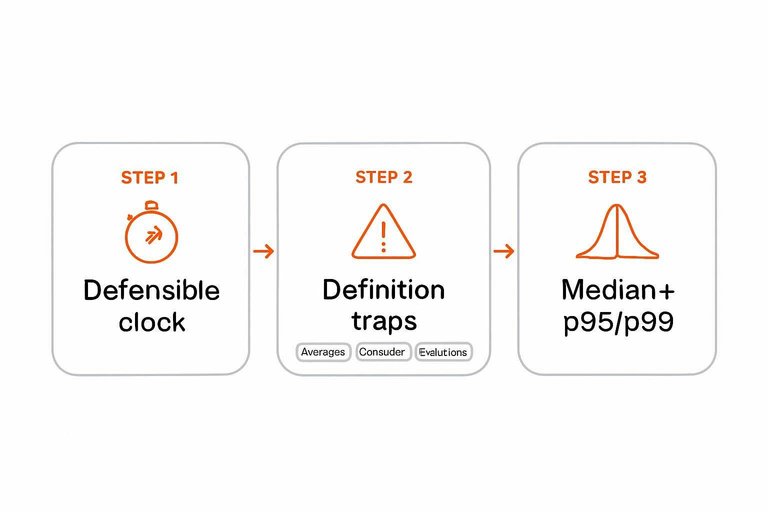
Definition traps (the table you need before you compare weeks or tools)
If two dashboards both say “first reply time,” you still might be looking at different clocks and different populations. This table pins down defensible start/stop events and the three ways teams accidentally (or conveniently) manufacture “improvements”: averages, clock drift, and exclusions.
| Metric | Defensible clock (start → stop) | Definition traps that fake improvements | What you publish (so it stays comparable) |
|---|---|---|---|
| First reply time (first human reply) | Customer joins/starts the chat → first human agent message sent | Clock start drift: switching start to “assigned/accepted” makes it look faster without changing the visitor wait. Exclusions: dropping chats with no human reply removes the worst cases. Averages: a few long misses disappear in the mean. | Median + p95/p99. State the exact start event (“customer joined/sent first message”) and whether no-reply chats are included or reported separately. |
| Wait time (customer-perceived first wait) | Customer joins/requests service → first human agent reply or visitor leaves | Silent censoring: reporting only “served” chats turns wait time into a best-case metric. Clock stop drift: stopping at “agent saw it” instead of “agent replied” lowers the number. | Median + p95/p99, with an explicit rule for no-reply (must end at “visitor left”). |
| Response time (subsequent) | Customer message (in an active conversation) → next agent reply | Turn pairing changes: redefining how you pair messages (burst vs per-message) can move the metric with zero behavior change. Eligibility drift: excluding “reopened” or “transferred” segments. | Median + p95/p99, plus the pairing rule (turn-based vs per-message) in one sentence. |
| Longest reply time (worst in-conversation gap) | Max over the conversation of (customer message → next agent reply) | Trimming the tail: capping gaps, ignoring overnight gaps, or excluding periods marked “away” makes the “worst” look safe. | p95/p99 of “longest gap per conversation,” and whether you’re using calendar time or a restricted-hours clock. |
| Time to close | Conversation start → conversation marked closed | Workflow-driven stop: auto-close timers, manual closure habits, or “never closed” threads disappearing from reports. Include/exclude rules: office-hours-only vs calendar time; bot/automation time included vs excluded. | Median + p95/p99, and the closure rule (“what event sets closed?”) plus any time-inclusion filters. |
Percentiles aren’t optional here: SLO practice treats tail latency (p95/p99) as first-class, and the Google SRE Book’s SLO guidance is explicit about using percentiles to reason about the distribution instead of pretending an average represents user experience.
Outcome metrics that count
Operational metrics (speed, delivery, coverage) only matter if they move an outcome you can measure without sampling tricks. Since CSAT and conversion-style outcomes are usually computed on a filtered subset of conversations, publish eligibility and coverage right next to the headline number—or you’ll optimize the subset your tool happens to include.
CSAT plus coverage
CSAT (conversation rating) is a customer satisfaction score collected after a conversation—commonly on a 1–5 scale—and it’s easy to misread because it depends on who gets asked and who actually answers. In Intercom, the underlying conversation rating value is stored as an integer from 1 to 5 (conversation rating model).
Treat “CSAT” as three numbers you publish together:
- CSAT score (1–5): average (or distribution) of ratings received.
- CSAT eligibility / send rate:
conversations_that_were_sent_a_rating / closed_conversations. - CSAT response rate:
ratings_received / ratings_sent.
Why be this strict: Intercom only sends conversation ratings under specific criteria (for example, rules tied to conversation length and how recently the conversation was closed). That means a rising CSAT score can reflect a changing sample, not improving support.
If your speed and reliability work is real, you should see it either in CSAT on a stable sample, or in coverage expanding without the score collapsing—that’s the “we improved the system, not just the report” signal.
Goal conversion
When you need an outcome metric that’s closer to revenue or retention, use explicit goals and compute conversion on the conversations that could realistically achieve them.
LiveChat’s Goals / “achieved goals” report is the right model: it shows how many chats ended with a purchase, signup, or any other goal you pre-set, and frames that as a direct representation of chat effectiveness.
Make your goal metric defensible by locking two definitions:
- Goal definition: what exactly counts as “achieved” (purchase, signup, lead captured, etc.). Keep the list short and written down.
- Eligibility definition (the denominator): which conversations had a fair chance to achieve that goal.
Then publish goal-achieved rate as:
eligible_conversations_with_goal_achieved / eligible_conversations
If you can’t state eligibility in one sentence, you don’t have a conversion metric yet—you have a count.
Trend window limits
Outcome metrics are most useful when you can compare against a stable baseline. But your reporting tool can silently cap what “baseline” even means.
Intercom’s Conversations reporting has two hard constraints:
- Reporting data is available for up to 2 years (lookback limit).
- The date range filter within a single report supports up to 1 year at a time.
So if you’re setting baselines or doing longer trend work, design around those limits up front (for example, by planning how you’ll stitch ranges or export). Otherwise you’ll end up “improving” because your window shifted, not because your chat message operations got better.
Viability checklist
Use the 11 metrics like a triage flow. You’re not trying to “improve chat” in the abstract; you’re trying to decide what to fix next—or to stop.
-
Lock what you’re counting (before you touch targets).
Write down the unit for every headline number: message vs conversation vs chat request, plus the eligibility rules (what gets excluded). If your tool has an export glossary, treat it as source-of-truth; for example, Zendesk Explore’s Chat Analytics CSV export is where these definitions are explicit. -
Fix leaks before speed.
If missed chat rate, acceptance rate, or unanswered inbound message rate is moving, speed charts are secondary. Leaks mean customers experienced silence, even if “first reply time” looks great on the served subset. -
Classify the problem: staffing/coverage vs product/system.
- If reliability is fine but wait/first-reply distributions are slow across the board, you have a coverage problem (availability, routing, schedules).
- If the median is fine but the tail is ugly (p95/p99), you have a system problem (queues, retries, delivery mechanics, or a specific hop).
-
Prove it’s not a measurement artifact.
Any “win” that coincides with a definition change (new start event, new exclusions, auto-close behavior) is not a win. Roll back the definition drift or publish the metric as “not comparable.” -
Call tooling limits early.
When your bottleneck is “the tool can’t show/segment/join what you need” (missing IDs, hidden acceptance reporting, no raw event timestamps), stop optimizing the metric and change what you can observe. -
Decide: invest vs keep it simple.
If leaks are controlled, tails are acceptable for your use case, and outcomes (CSAT/goals) aren’t being driven by sampling quirks, “keep it simple” is defensible—set guardrails and move on.
Measure the pipeline, not averages
If you want chat to create customers, stop treating a single “average reply time” as the truth—because late, missing, retried, or excluded messages can make the dashboard look healthy while visitors experienced silence. The defensible 2026 approach is to name the unit you’re counting, join events end-to-end with stable IDs, and timestamp the hops so you can prove where delays and loss actually occur. Check for leaks first (missed requests, routed-but-not-served chats, inbound messages that never get a reply), then hold time metrics to distributions (p50 plus p95/p99) so the tail can’t hide. Your first action: write down the exact start/stop events and eligibility rules for your headline metrics, and mark any number “not comparable” until it’s backed by message-level joins across the path.
Frequently Asked Questions
- What’s a good first reply time for a website live chat message in 2026?
- Zendesk’s benchmark examples call “Best” first response time for live chat “instantly” and “Good” “1 minute or less.” Use those as an external reference point, then publish your median plus a tail percentile so you can see whether delays are concentrated in the worst cases.
- How far back can I report on chat message metrics in Intercom (and what’s the max date range per report)?
- Intercom conversation reporting data is available for up to 2 years, and a single report supports a maximum date range of 1 year. If you need longer comparisons, you have to export or store the raw events elsewhere.
- Is a conversation-level “response time” the same thing as chat message response time?
- Not quite: conversation-level response time is an aggregate over a thread, while chat message response time measures a specific customer message paired to the next agent reply. If you don’t publish the pairing rule and the unit (message vs conversation), you can’t compare numbers across tools or weeks.
- Will adding a chat message widget slow down my site?
- It depends on the widget’s payload and loading behavior; Eloqra states its script is ~5kb and is designed to be lightweight. Validate impact by measuring Core Web Vitals before and after installing the chat script.
- What happens if my Telegram-routed chat message volume exceeds Telegram’s free broadcast limit?
- Telegram’s bots FAQ states that paid broadcasts cost 0.1 Stars per successfully broadcast message over the free 30/sec limit, and enabling paid broadcasts requires a minimum balance of 100,000 Stars and at least 100,000 monthly active users for the bot. Track 429 errors and queued sends so you can see when throughput limits start turning into delivery failures.
Run live chat from Telegram
Once your metrics are defined, the bottleneck is usually execution: staying responsive without babysitting a dashboard, and keeping each visitor message tied to the right context.
Eloqra forwards every website chat message to your Telegram and lets you reply from your phone with page, device, and country context included. Start with the Free Forever plan.
Written by
Eloqra
Notes from the Eloqra team on collecting testimonials and building authentic social proof.
Share: